Hi!
Is it possible to make the contour plot transparent for upper/lower bound values?
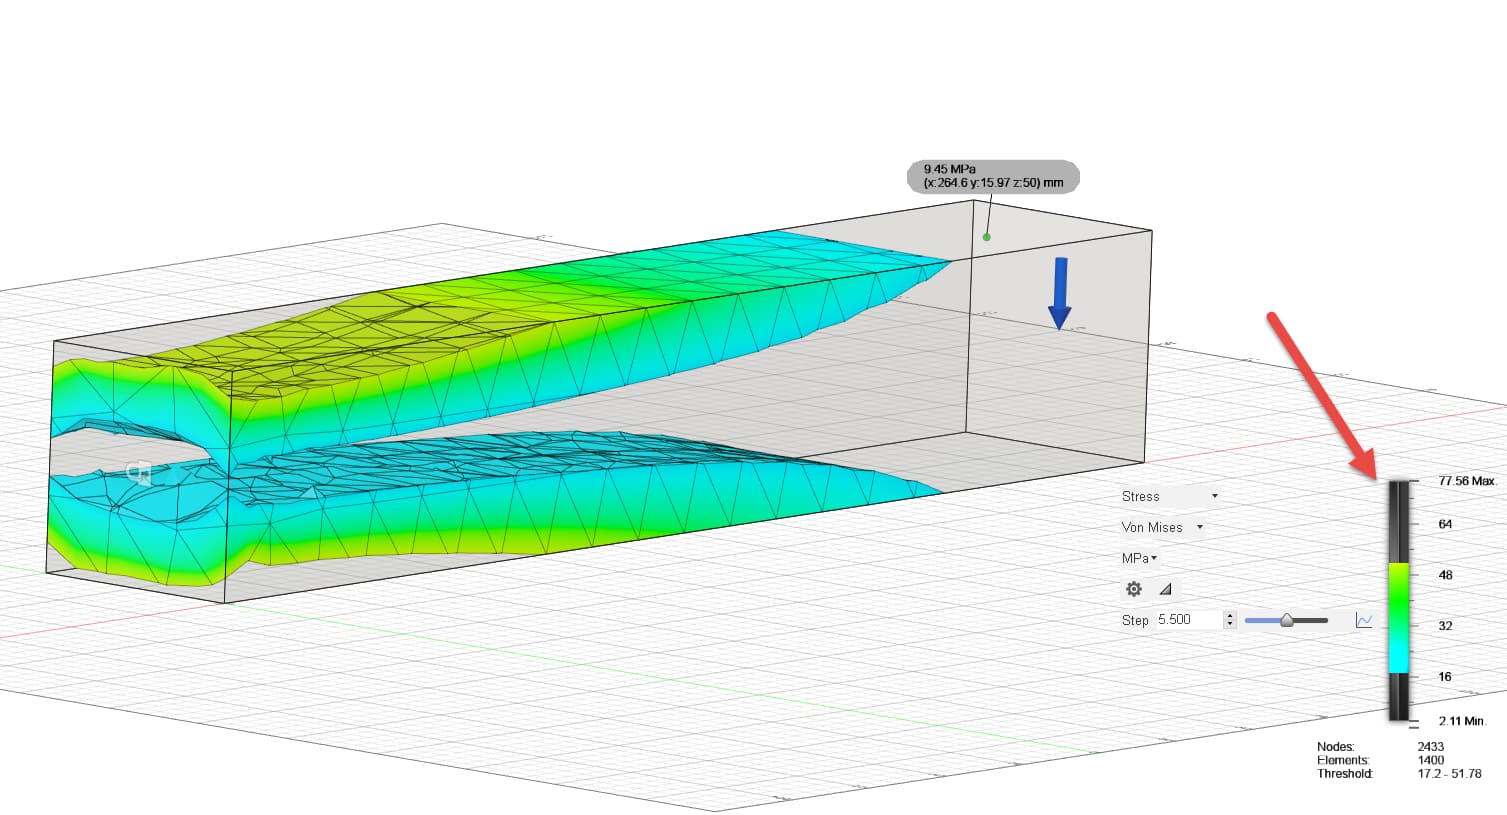
In inventor Fusion I can drag the contour slide bar up and down to highlight a certain range of results. The rest is transparent:
Regards
Siggi
Hi!
Is it possible to make the contour plot transparent for upper/lower bound values?
In inventor Fusion I can drag the contour slide bar up and down to highlight a certain range of results. The rest is transparent:
Regards
Siggi
You can assign a different color (like gray or black, for instance) to the values outside the limit. To do it, go to Tools → Settings → Legend (accessible also by double-clicking on the legend) and switch Min/max limit type to Manual. Then you can choose Min color and Max color. One of the settings is Transparent but it’s actually just white.
You can also add transparency to parts (right-click and choose Set Transparency) but it applies to colored regions (inside the range) as well.
It would be a nice feature to have. One can filter elements by the results visualization this way.
I think this is built into the VTK that PrePoMax uses so that it could be added without much work.
Actually, why is the Transparent setting the same as White ?