Displacement - Max displacement is observed in both model at same node with small deviation in magnitude
von Mises Stress / Max Principal (Abs) - Again the location for maximum value is same but there is deviation in max value
For S11 component of stress, as you can see the location of maximum value and the magnitude differs a lot.
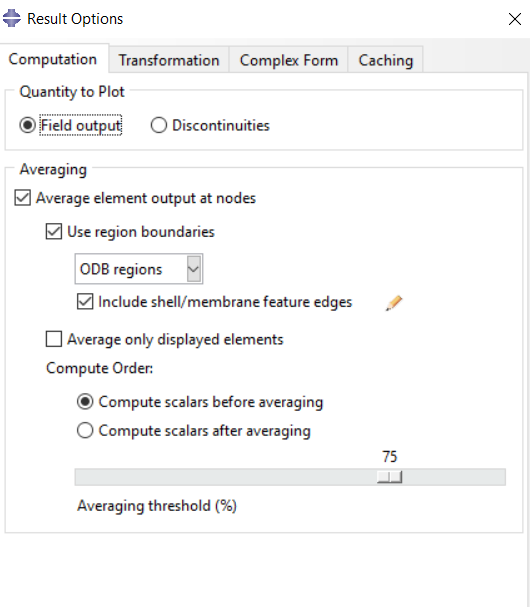
As I have understood, in PrePoMax all values are nodal values ( but I don’t know what kind of avaraging is done here ) , and in abaqus I am using default averaging as shown in picture below:
First of all - are the models identical ? Which basically means that you either used the same mesh and manually redefined everything in Abaqus or (the best way) used the same input file, only with the necessary modifications due to small syntax differences.
Yes, both models are identical in all aspects, with node numbering, element numbering, material, BCs and load. Those are the same models which I have shared in my previous post by google drive.
The results in abaqus are only displayed Solid elements. No membrane elements are considered here. Although I can again confirm by having purely solid elements, by running new job.
I used the same input file (with only solid elements to avoid differences in membrane formulation/visualization) and I can confirm those differences in results. You could try using different meshes to see how close you can get.
In this case the highest stress is at the rigid connection. Maybe there is some averaging error at the constrained nodes. To check it you can try inverting the load and supports.
Abaqus doesn’t have this form of plots. I can only disable averaging and create so-called quilt plot. Or query the stresses at particular integration points.
There is a big difference in Abaqus between the averaged and unaveraged stress for component S11:
averaged = -0,884 / 0,884
unaveraged = -1,515 / 1,515
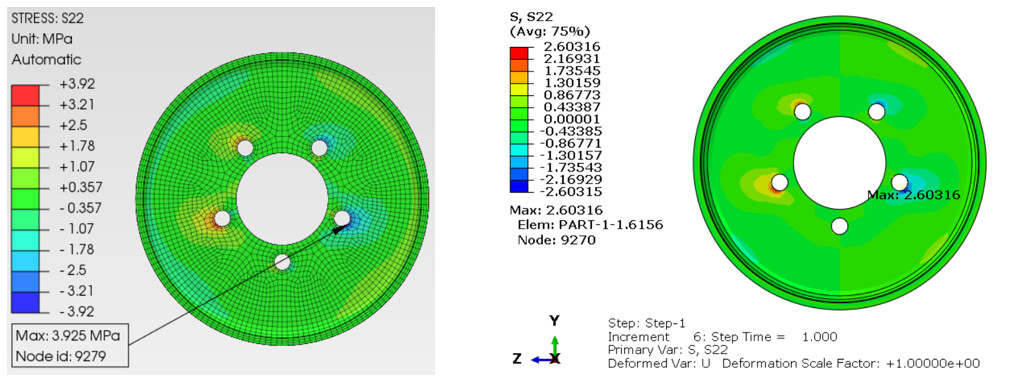
while the values for S22 are very close:
averaged = -2,603 / 2,603
unaveraged = -2,611 / 2,611
in code aster i have for S11:
averaged = -3,013 / 3,013
unaveraged = -3,096 / 3,096
 statistics for surface set DISK and time  0.1000000E+01

   total surface force (fx,fy,fz) and moment about the origin(mx,my,mz)

    4.503173E-04  1.890045E-11 -7.493543E+01  9.126258E-05 -1.188226E+04  3.964118E-08
True, but when you fix in addition the reference point and leave only UR2 free, the moment is 10.901 Nmm.
If you then fix only U1 of the surface (U2+U3 free), you get 9.664 Nmm.
I don’t think there is something wrong with the calculix results because all values i compared with code aster are nearly exact the same. For example the stresses for element 5134 at the gauss points:
stresses (elem, integ.pnt.,sxx,syy,szz) for set ELEMENT_5134